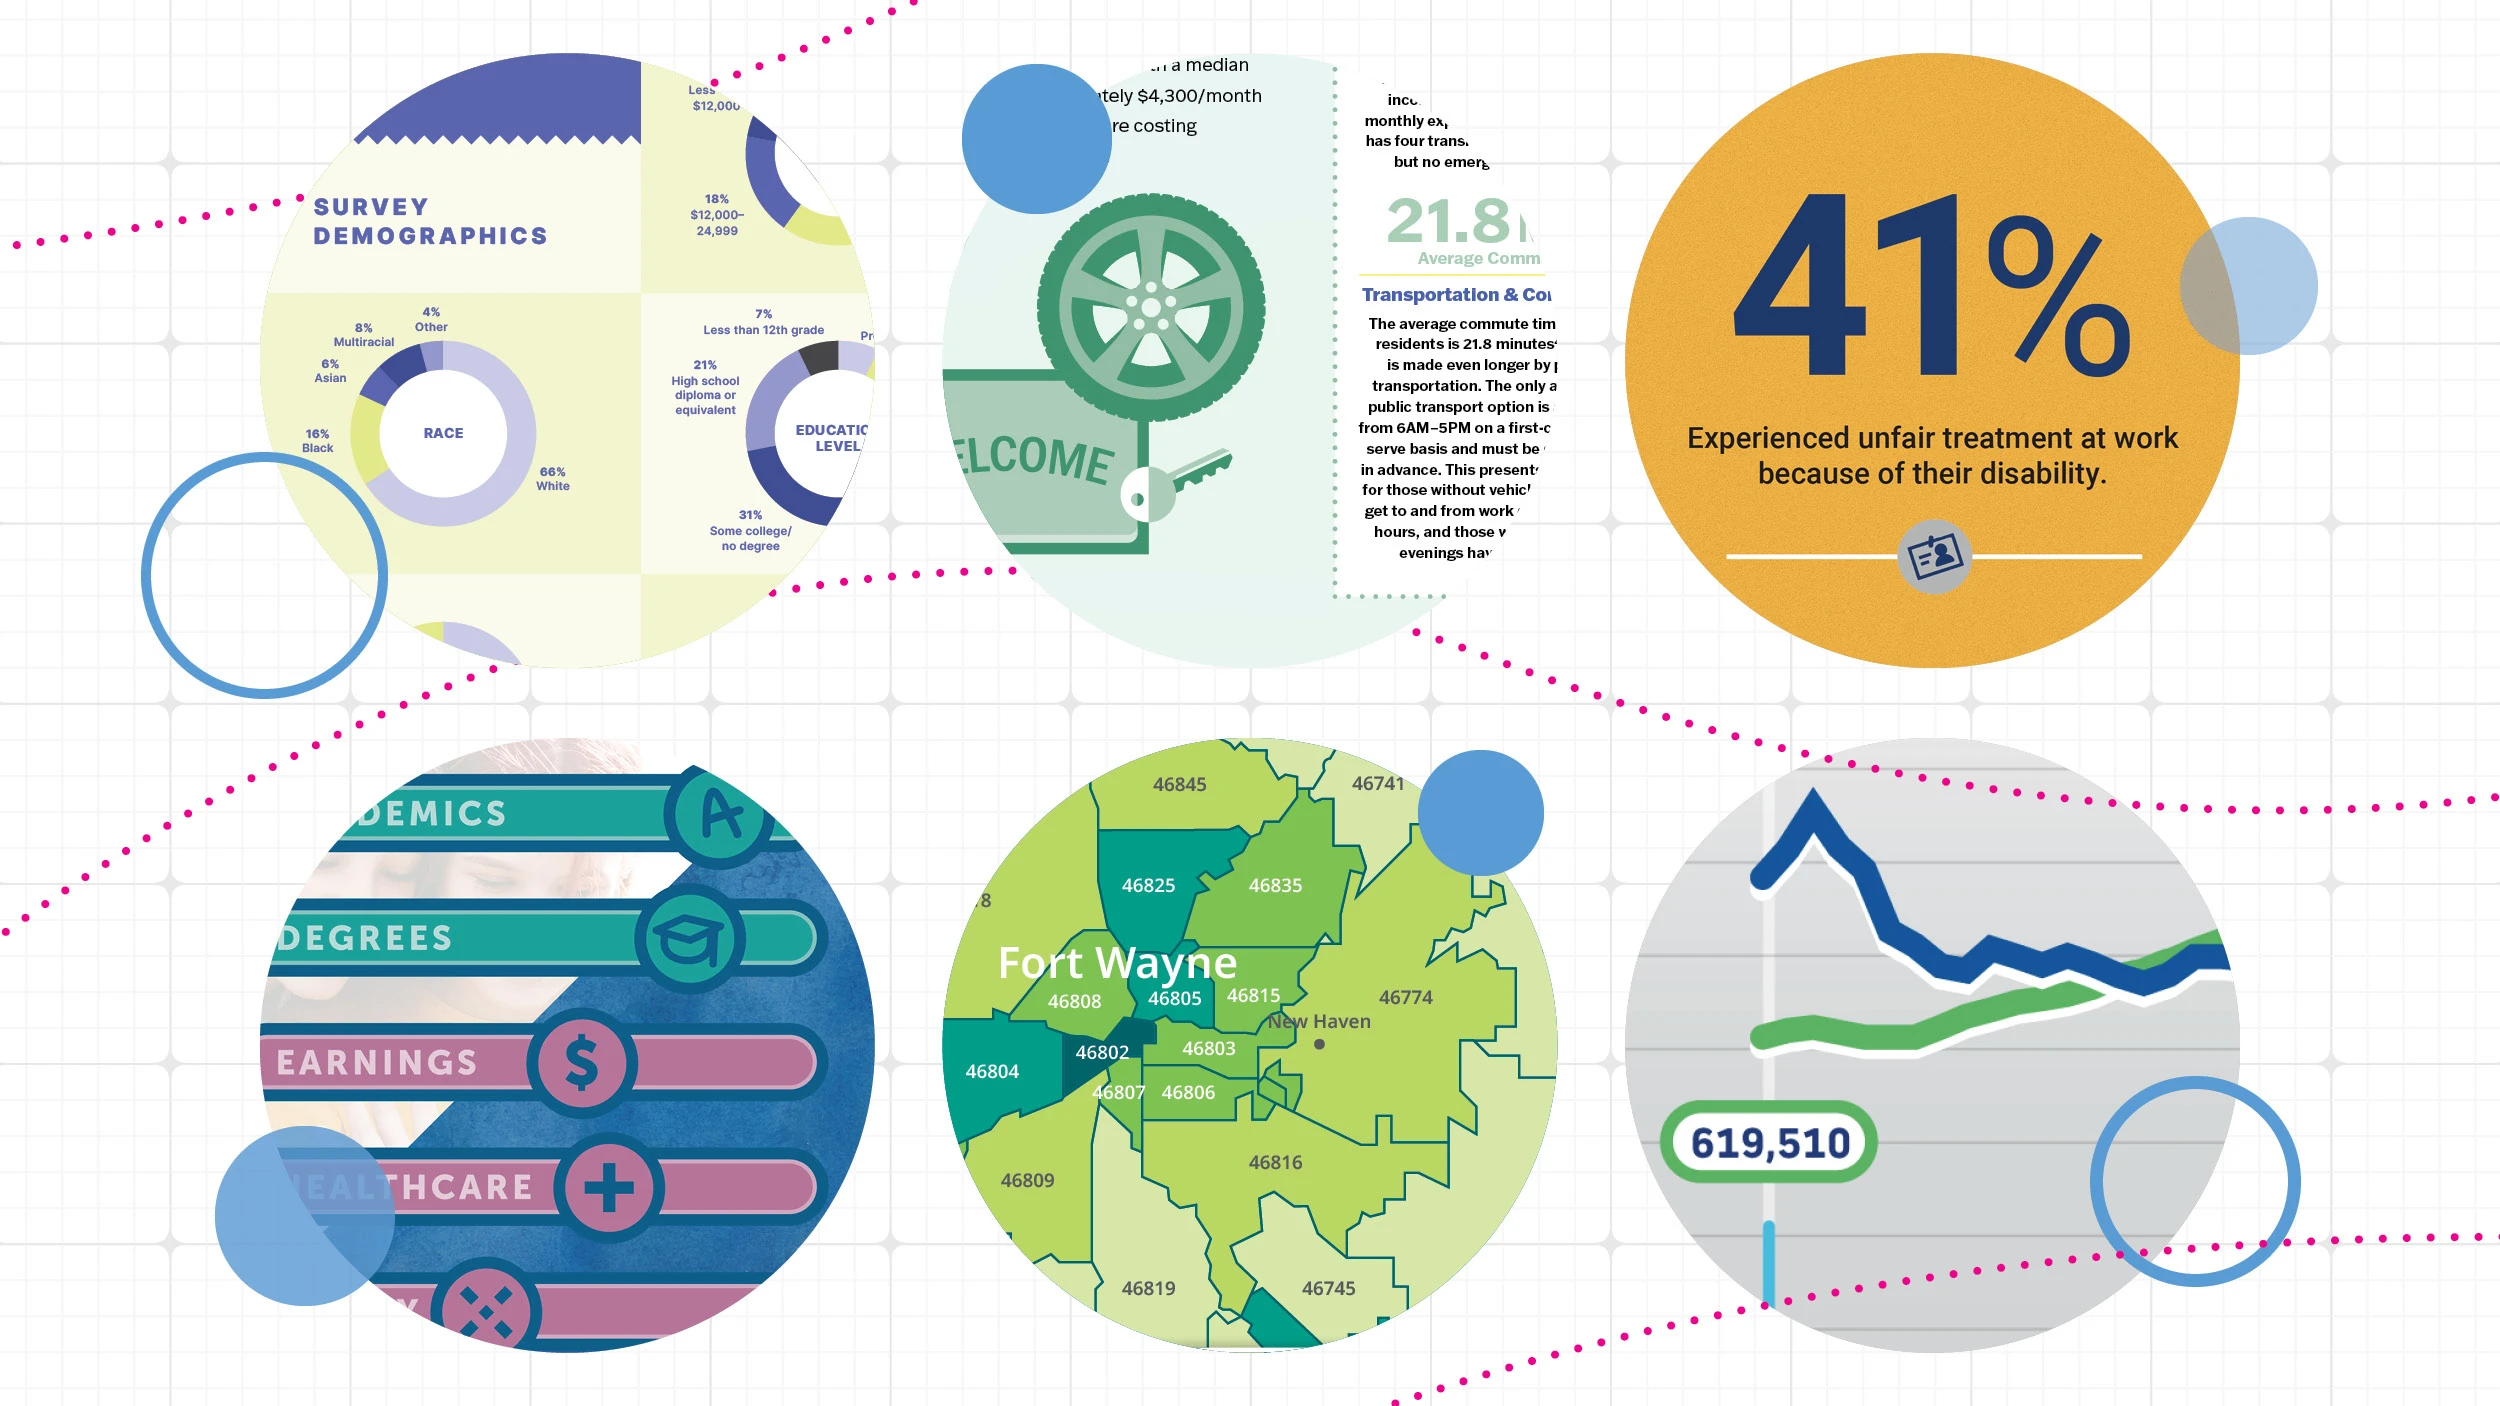
From annual reports, to community studies, to action plans, presenting data that supports your mission, positioning or business case—your why—can be a powerful tool for appealing to your constituents.
There’s an adage, “The numbers speak for themselves,” that can be true in some instances. But, for most audiences, too many tables or charts can be time-consuming to distill useful, actionable information from. It may prevent your report from having a sticky or memorable quality, ultimately failing to inspire whatever action you hope your audience to take.
As the stewards of data and information, it’s our responsibility to:
• Present it clearly and concisely.
• Position it in the context of the “bigger picture,” or what we’re trying to accomplish.
• Establish reliability, relatability and relevancy in our word choice and tone.
So, how can you most effectively leverage data to rally investors, donors, supporters and beyond?

Create a Narrative from the Data
Your data represents the experiences of individual people and organizations, as well as entire communities—use it to create a narrative, a story that helps your audiences understand the implications of what you learned, from start to finish. Often, a “theme” naturally occurs, allowing you to thread the narrative throughout the report. Keep your audience in mind, too; this narrative may be strengthened by removing academic jargon. Consider that you’ll craft a narrative from your data early in the development of any research you’ll do—internally or externally. This will help you craft your approach more intentionally.

Identify Key Takeaways
If your audience only walks away remembering three or four things from your 20+ page report, what do you want them to be? In a research report or plan, they should be placed at the forefront of your report, and clearly labeled “key takeaways.” If your report includes next steps or some kind of plan, be sure those are clearly and concisely communicated, even if it’s at the end. In an annual report, the “key takeaways” may represent the primary areas of services or programs you offer, giving them prominent real estate as the “feature stories” in the report.

Incorporate Stories
You’ve done the work, but your perspective doesn’t have to be the only one featured. Strengthen your position by incorporating outside stories—whether from a partner in the research, or an end-user that’s affected by the outcome. “Stories” can take on many shapes and forms, too, including full-length features, single-paragraph callouts or even single attributed quotes. Their stories can augment the impact of your data, applying real-life situations to generalized, representative numbers.

Tell Your Story
Just because someone has come across your report, doesn’t mean they understand who you are, what you do or what you stand for. These pieces may be your first impression on a potential new customer, donor or client—make it distinct, and memorable.
When you merge the analytical power of data with the emotive strength of storytelling, you create a captivating appeal that will help you move closer to your goals.
Interested in learning more about our process or areas of expertise? Hit us up.
About One Lucky Guitar
One Lucky Guitar is a boutique creative agency in downtown Fort Wayne, Indiana. Our mission statement is “We communicate brand soul.” We believe we can generate the greatest results, through the best work—creating pride in those we serve.
We provide brand development services to mission-driven people, organizations and companies who make the worlds of those they serve a little better.
We work with people we trust. We work for people we respect. We do work we can believe in. Want to learn more about our services? Click here.


